Why and How to Evaluate Energy Storage Project ROI?
Understanding how to evaluate the roi of an energy storage project requires more than comparing equipment prices. A project may appear profitable on paper, yet struggle after grid charges, degradation, financing costs, and market volatility are included. Dr. Imre Gyuk, former director of the U.S. Department of Energy’s Energy Storage Program, has said, “Energy storage is the key to unlocking the full potential of renewable energy.” That potential depends on disciplined financial analysis.
Imagine a 100-megawatt, 200-megawatt-hour battery beside a solar plant. Its business case could combine energy arbitrage, capacity payments, frequency regulation, and avoided curtailment. Each revenue stream needs separate assumptions. How often will the battery cycle? What happens after ten years? A two-hour system may earn less than expected when market spreads narrow. Degradation matters.
So does timing.
A credible ROI model should calculate capital expenditure, augmentation costs, operating expenses, insurance, taxes, debt service, and decommissioning. It should test payback period, internal rate of return, net present value, and levelized cost of storage. Sensitivity analysis should challenge battery prices, electricity spreads, interest rates, availability, and merchant exposure. Use real operational data where possible, not attractive guesses.
There is no perfect forecast. That is the uncomfortable part. Revenue stacking can create value, but overlapping services may not be available simultaneously. A strong evaluation records every assumption, explains its evidence, and tests pessimistic scenarios. This approach reflects practical experience, technical knowledge, and financial accountability. It also helps investors see whether returns come from durable project value or temporary market conditions.
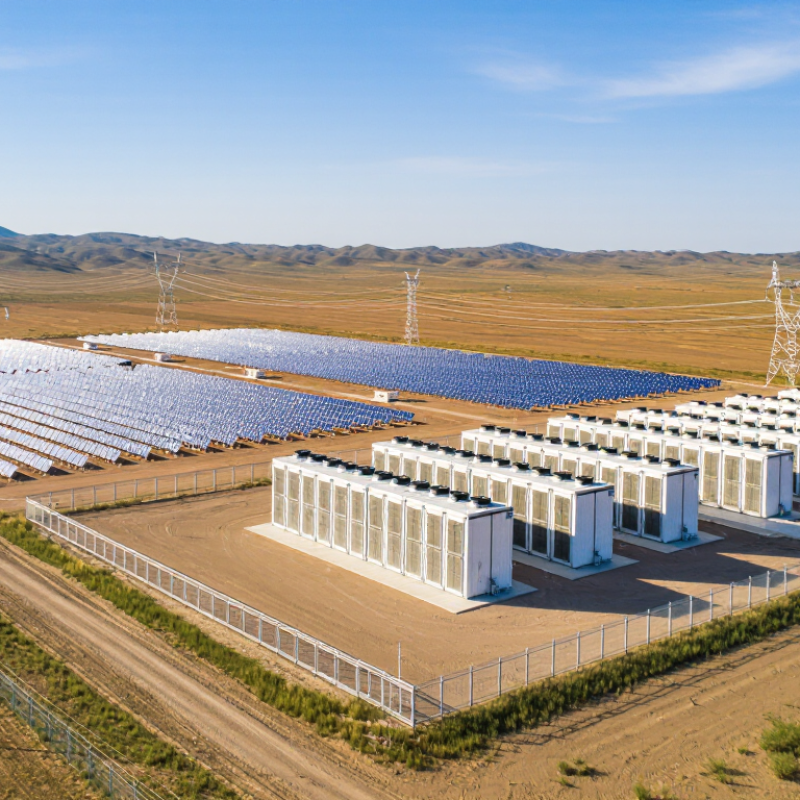
Define Storage ROI Scope: Revenue Stacking, Costs, and 85–90% Round-Trip Efficiency
Why and How to Evaluate Energy Storage Project ROI?
A credible storage ROI model starts by defining its boundary. Include every revenue stream, not only energy arbitrage. A project may earn from capacity availability, frequency response, demand-charge reduction, and renewable energy shifting. These streams rarely peak together. That matters.
Model dispatch using hourly prices and realistic operating limits. An 85–90% round-trip efficiency means some purchased energy disappears as heat. For every 100 kilowatt-hours charged, only 85–90 kilowatt-hours may return. Include auxiliary loads, maintenance, insurance, grid fees, software, land, financing, and replacement costs. Battery degradation also reduces future revenue. In practice, early forecasts often look too clean. Mine did.
Tips: Build three cases: conservative, expected, and optimistic. Stress-test lower price spreads, reduced availability, and faster degradation. Separate gross revenue from net cash flow. Record the source and date of every assumption. A spreadsheet is not evidence by itself.
Use measured site data whenever possible. Compare the model with interval meter readings, dispatch logs, and maintenance records. Then calculate simple payback, net present value, and internal rate of return. Payback alone can mislead when major replacement costs arrive later. Also test whether stacked revenues conflict operationally. A battery committed to reserves cannot always chase the highest hourly price. That trade-off should be visible. The strongest ROI case is not the most attractive one; it is the case that remains reasonable when assumptions become uncomfortable.
Benchmark CAPEX with BloombergNEF’s 2024 Battery Pack Price of $115/kWh
Evaluating energy storage ROI starts with a realistic capital baseline.
BloombergNEF’s 2024 battery pack price is $115/kWh. This figure helps test whether a project budget is reasonable. However, it does not represent total installed CAPEX.
A 100 MWh system implies $11.5 million for battery packs alone. That estimate excludes containers, inverters, transformers, land, construction, software, grid studies, and commissioning. It also excludes financing costs and replacement reserves. That gap matters. In practice, I compare the pack benchmark with supplier quotations and recent construction invoices. Regional labor costs can change the result sharply. Import duties and project duration can also distort comparisons.
ROI depends on more than a low purchase price.
I calculate annual revenue from energy arbitrage, capacity payments, and grid services. Then I subtract charging losses, maintenance, insurance, degradation, and market fees.
A simple payback model may look attractive at 85% round-trip efficiency. Yet performance can decline after repeated cycling. My early models often overstated revenue because they assumed perfect dispatch and constant price spreads. That was unrealistic. A stronger review tests conservative, expected, and stressed cases. It also checks battery augmentation timing, warranty limits, and available grid capacity before approving the investment.
Forecast Cash Flows Using 2–3% Annual Degradation and Operating Costs
A credible energy storage ROI model begins with measured operating data, not optimistic assumptions. Estimate annual discharged energy from capacity, round-trip efficiency, availability, and dispatch patterns. Then apply 2–3% annual degradation to usable capacity. A simple forecast uses Year 1 output multiplied by (1 − degradation rate) for each later year. The difference becomes meaningful over a ten-year project.
Operating costs must be visible in every cash-flow year. Include scheduled maintenance, software, insurance, site leases, grid charges, and replacement reserves. Separate fixed costs from variable costs linked to energy throughput. A battery earning strong revenue may still produce weak returns when cycling costs and market fees are ignored. Small omissions matter.
Use base, conservative, and stress cases. Test 2% degradation with stable prices, then 3% degradation with lower spreads and higher maintenance costs. Compare annual revenue, operating expenses, debt service, and taxes against the initial investment. In project reviews, I have seen models overstate savings by using flat output curves. That mistake is common. Real dispatch is uneven. Weather, congestion, and price volatility can change monthly results. A spreadsheet can still be wrong. Validate assumptions against meter records, contractor estimates, and independent market data before approving capital. Recalculate internal rate of return and payback after every major assumption changes.
Calculate NPV, IRR, Payback, and LCOS Across a 10–15-Year Project Life
A credible energy storage ROI review starts with a 10–15-year cash-flow model, not a headline price. For a 100 MW/400 MWh system, record construction cost, interconnection fees, operating expenses, degradation, augmentation, insurance, and removal costs. Battery pack prices fell to about $115/kWh in 2024, according to BloombergNEF’s Battery Price Survey. However, pack cost is not total project cost.
Build annual cash flows from energy arbitrage, capacity payments, ancillary services, and contracted revenue. Then discount them using a rate matching project risk. NPV shows value in today’s money. IRR shows the project’s implied annual return. Payback identifies when cumulative cash flow turns positive, but it can ignore revenue after that point. Test a 10-year and 15-year life separately. Small assumptions matter.
LCOS should include capital recovery, charging energy, efficiency losses, fixed costs, replacement capacity, and discharged megawatt-hours. Lazard’s 2024 Levelized Cost of Storage Analysis placed unsubsidized four-hour storage LCOS around $110–$228/MWh. That range is wide for a reason. Market prices, cycling frequency, and financing can change quickly. A project earning $180/MWh may look attractive until degradation reduces usable capacity by 20%. I would also stress-test a two-year delay, lower spreads, and higher augmentation costs. The spreadsheet may look precise. The forecast is not.
Stress-Test ROI Against 4-Hour Dispatch, Price Volatility, and WACC Changes
Energy storage ROI is not a single number. It depends on dispatch, market prices, degradation, and financing. The International Energy Agency reported more than 40 GW of battery storage additions globally in 2023. This growth increases competition for profitable hours. It also makes optimistic forecasts less comfortable.
A practical model should begin with a four-hour dispatch case. Test one daily cycle, two cycles, and partial cycling during low-price periods. Include round-trip efficiency, auxiliary load, and annual capacity fade. A battery may deliver 400 MWh today, but less after several years. Small errors compound. The 2024 Levelized Cost of Storage analysis showed utility-scale storage costs varying widely, roughly from 110 to 215 dollars per MWh for common configurations. That spread can erase projected returns.
Price volatility needs a second stress test. Replace average prices with hourly historical data, then reduce peak-price capture by 10% or 20%. Add negative-price hours and missed dispatch events. The result is usually more realistic. WACC deserves equal attention. Recalculate project value at 6%, 8%, and 10% WACC, while keeping operating assumptions unchanged. A higher discount rate can weaken NPV quickly, especially for projects with large upfront costs. I would also test a delayed grid connection. It is often ignored, yet one lost operating quarter can distort the entire investment case. A clean spreadsheet may still be wrong.
Why and How to Evaluate Energy Storage Project ROI? - Stress-Test ROI Against 4-Hour Dispatch, Price Volatility, and WACC Changes
Illustrative utility-scale battery storage model using a 100 MW / 400 MWh system and a 15-year evaluation period. Monetary values are shown in real 2026 USD.
Project and Financial Assumptions
| Installed power and energy capacity |
100 MW / 400 MWh, equivalent to a 4-hour duration system |
| Initial capital expenditure |
$280 million, or $700 per installed kWh |
| Annual fixed operating cost |
$5.6 million in Year 1, escalating at 2.0% annually |
| Round-trip efficiency |
88% |
| Operating life and degradation |
15 years; usable energy capacity declines by 2.0% per year |
| Annual dispatch profile |
330 equivalent full cycles per year, with 4-hour daily dispatch capability |
| Revenue sources |
Energy arbitrage, ancillary services, and capacity or resource-adequacy payments |
| Tax, financing, and incentives |
Unlevered, pre-tax analysis; incentives and tax credits excluded to isolate operating economics |
ROI Stress Test by Dispatch Duration, Price Volatility, and WACC
| Scenario |
Operating Case |
Operating and Revenue Metrics |
Investment Returns |
| Dispatch Duration |
Price-Spread Change |
Year 1 Gross Revenue |
Year 1 Net Cash Flow |
WACC |
NPV |
Unlevered IRR |
Simple Payback |
| Base Case |
Moderate volatility and contracted capacity value |
4 hours |
0% |
$37.0 million |
$31.4 million |
8.0% |
$43 million |
10.9% |
8.9 years |
| Low-Volatility Stress |
Energy price spreads contract as renewable penetration increases |
4 hours |
-25% |
$32.5 million |
$26.9 million |
8.0% |
$4 million |
8.6% |
10.4 years |
| High-Volatility Upside |
More frequent scarcity events and wider peak-to-off-peak spreads |
4 hours |
+30% |
$41.9 million |
$36.8 million |
8.0% |
$91 million |
13.6% |
7.6 years |
| Higher-Cost-of-Capital Stress |
Base operating case with tighter financing conditions |
4 hours |
0% |
$37.0 million |
$31.4 million |
10.0% |
$5 million |
10.9% |
8.9 years |
| Severe WACC Stress |
Base operating case with materially higher required returns |
4 hours |
0% |
$37.0 million |
$31.4 million |
12.0% |
-$29 million |
10.9% |
8.9 years |
| Short-Duration Case |
Lower energy capacity with stronger power-oriented services |
2 hours |
-10% |
$29.0 million |
$23.4 million |
8.0% |
-$38 million |
6.5% |
12.0 years |
| Extended-Duration Case |
Additional energy capacity captures longer-duration price spreads |
6 hours |
+10% |
$42.8 million |
$35.0 million |
8.0% |
$63 million |
12.2% |
8.0 years |
| Combined Downside |
Lower volatility, higher WACC, and reduced dispatch utilization |
4 hours |
-25% |
$32.5 million |
$26.9 million |
12.0% |
-$70 million |
8.6% |
10.4 years |
Interpretation: NPV is calculated over 15 years using undiscounted initial investment and annual operating cash flows adjusted for 2.0% degradation and 2.0% operating-cost escalation. A project is generally more resilient when its 4-hour dispatch value is supported by multiple revenue streams rather than energy arbitrage alone.
Conclusion
Evaluating the return on an energy storage project requires a clear view of how the asset creates value and incurs costs. The process begins by defining the ROI scope, including revenue stacking from energy arbitrage, capacity support, and grid services, while accounting for an expected round-trip efficiency of 85–90%. Capital costs should be benchmarked using realistic battery-system assumptions, while operating expenses, replacement needs, degradation, and financing costs are included in the model.
To determine how to evaluate the roi of an energy storage project, forecast annual cash flows over a 10–15-year life and assume approximately 2–3% annual performance degradation. Key metrics should include NPV, IRR, payback period, and levelized cost of storage. Finally, stress-test the results under different four-hour dispatch patterns, electricity-price volatility, efficiency levels, and weighted average costs of capital. This approach reveals whether projected returns remain attractive under both favorable and adverse market conditions.

 CCSC Energy